See what every CPU core ran - and why it waited
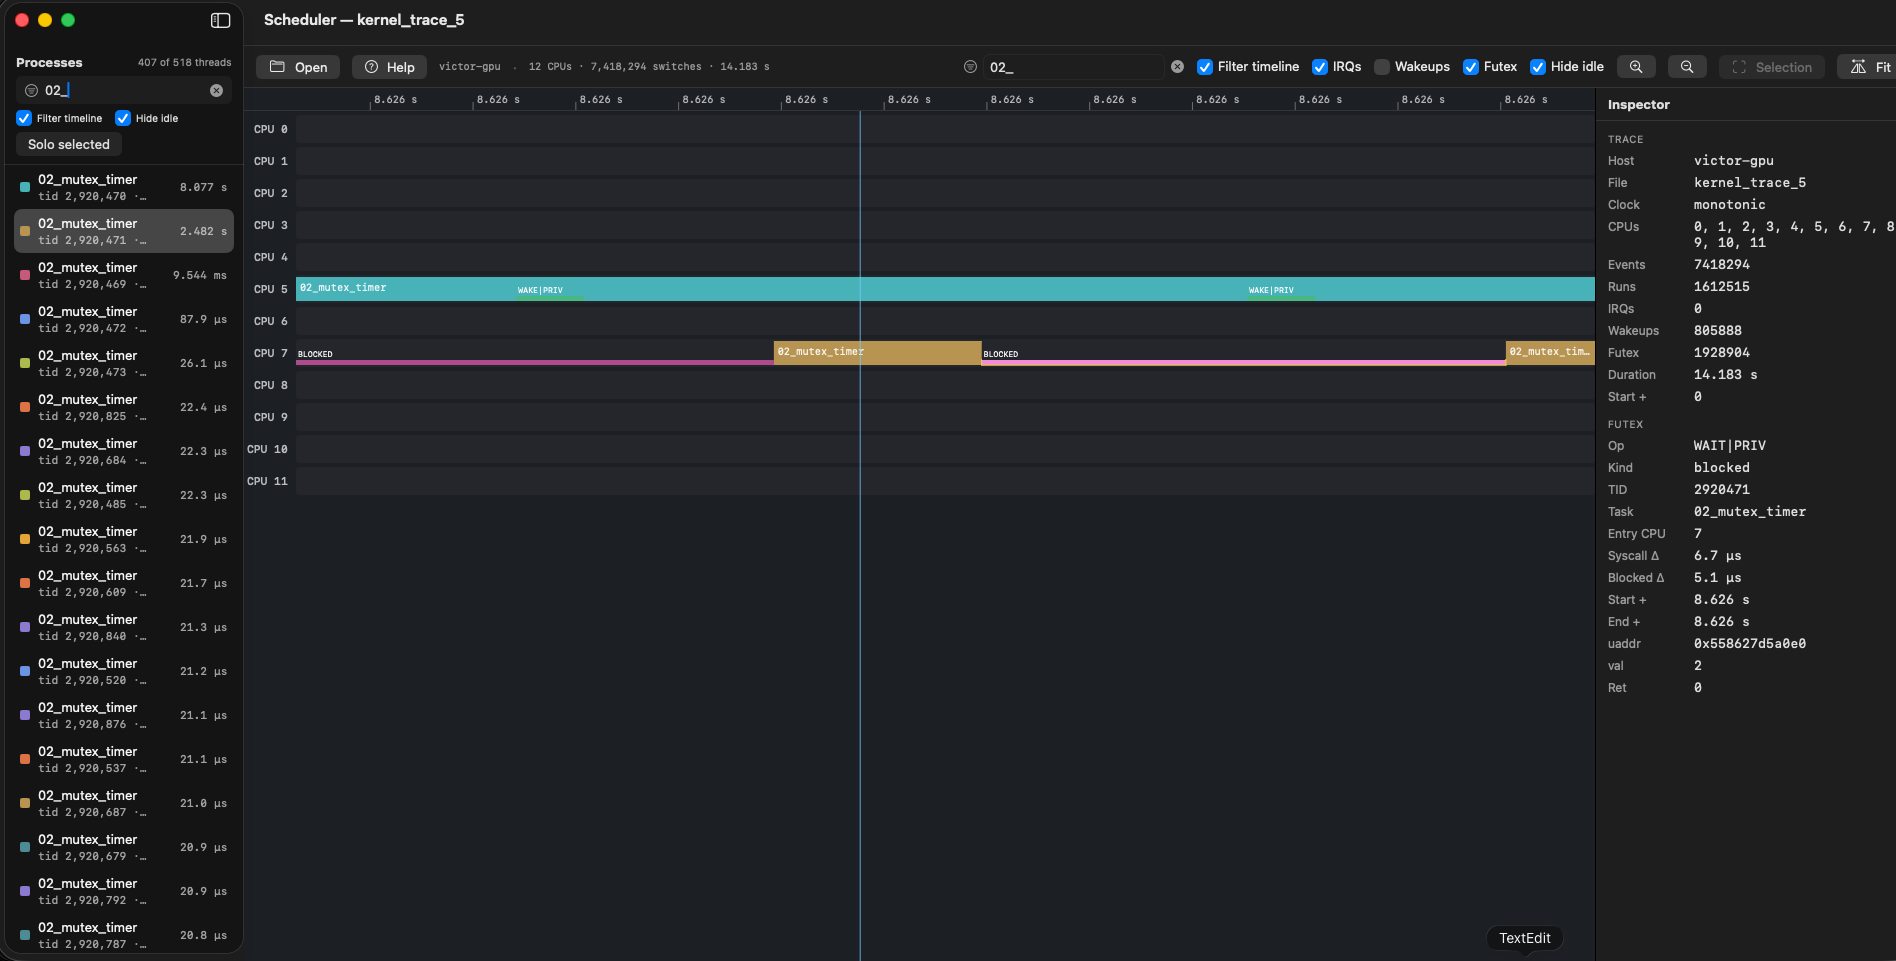
Corelapse is a native Linux tracer and profiler for macOS. Turn LTTng tracing data into a clear, interactive timeline for scheduler profiling, lock contention, and interrupt latency.
Linux performance, made visible
Stop digging through trace logs. See the behavior that matters.
See every core
Follow tasks across CPUs and instantly spot scheduling gaps, migrations, and unexpected activity.
Reveal lock contention
See when threads truly block, who wakes them, and how much time synchronization costs.
Understand latency
Connect interrupts, wakeups, and execution to find where your response time disappears.
Explore without friction
Open large traces, filter processes, zoom from seconds to nanoseconds, and measure any interval.
Find the lock that stalls your pipeline
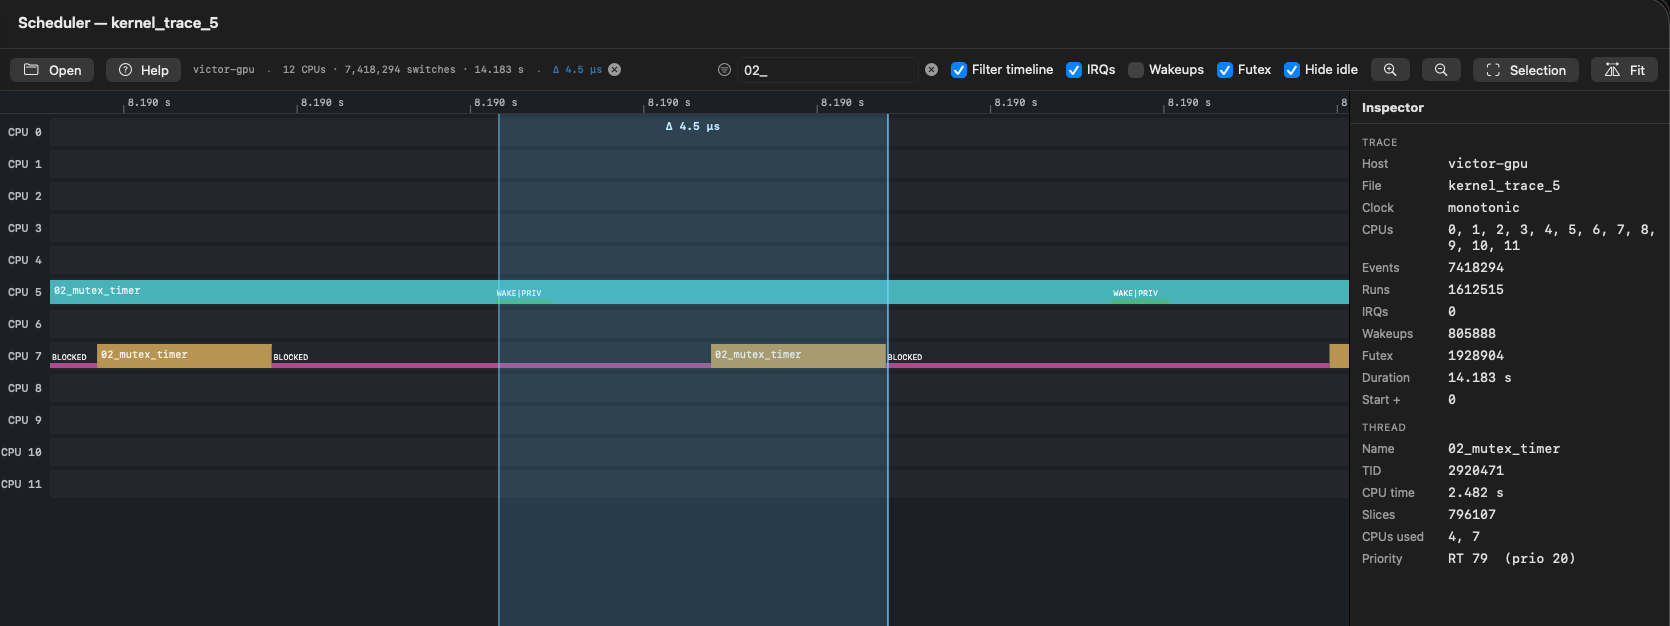
Corelapse turns futex activity into a visual story. See blocked threads, wakeups, and lock handoffs together with the scheduler timeline.
IRQ latency at a glance
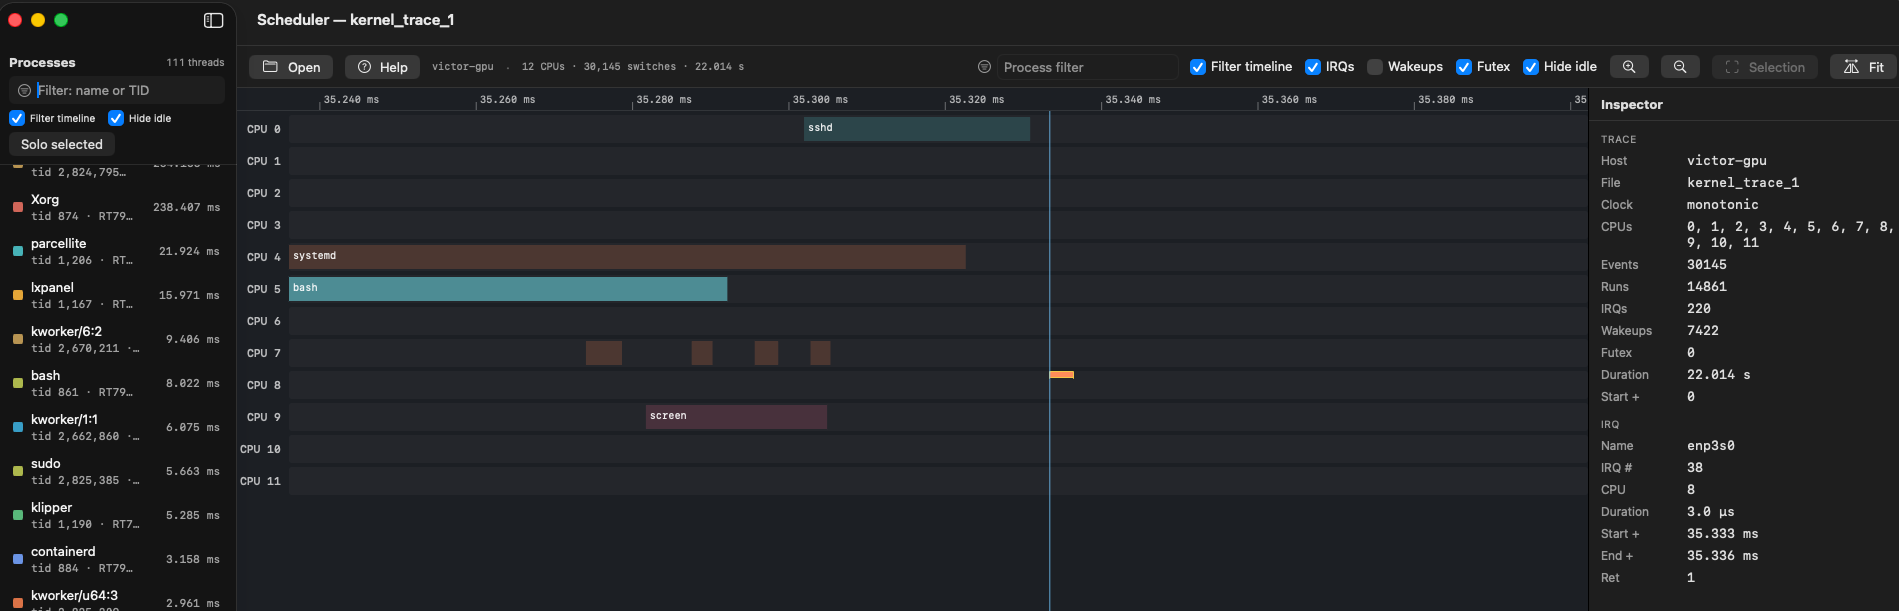
See interrupts in context. Follow the path from IRQ to wakeup to execution, and identify the delays that ordinary profilers miss.
Community & contact
Questions, feature requests, or a trace that renders wrong? We want to see it.
Mac App Store
Download Corelapse for macOS 14+. Free scheduler timeline; optional Full Access unlock.
Download on the Mac App Store
Discord
Community chat, questions, and feedback from other trace wranglers.
discord.gg/znzzy4MCd
Talk to us about feedback, support, or licensing.
info@corelapse.co